Technical Information
Select Section
Australia


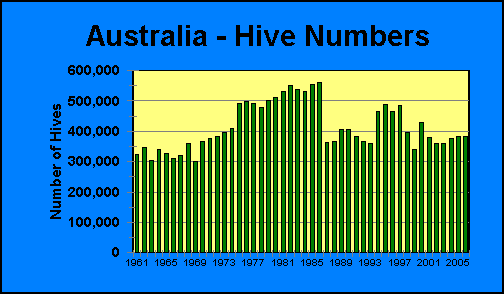
This Graph records the disappearance of honey into the Australian market, i.e. Imports plus Production less Exports. No account has been taken of end of year stocks, and this may mean significant differences from one year to the next.
